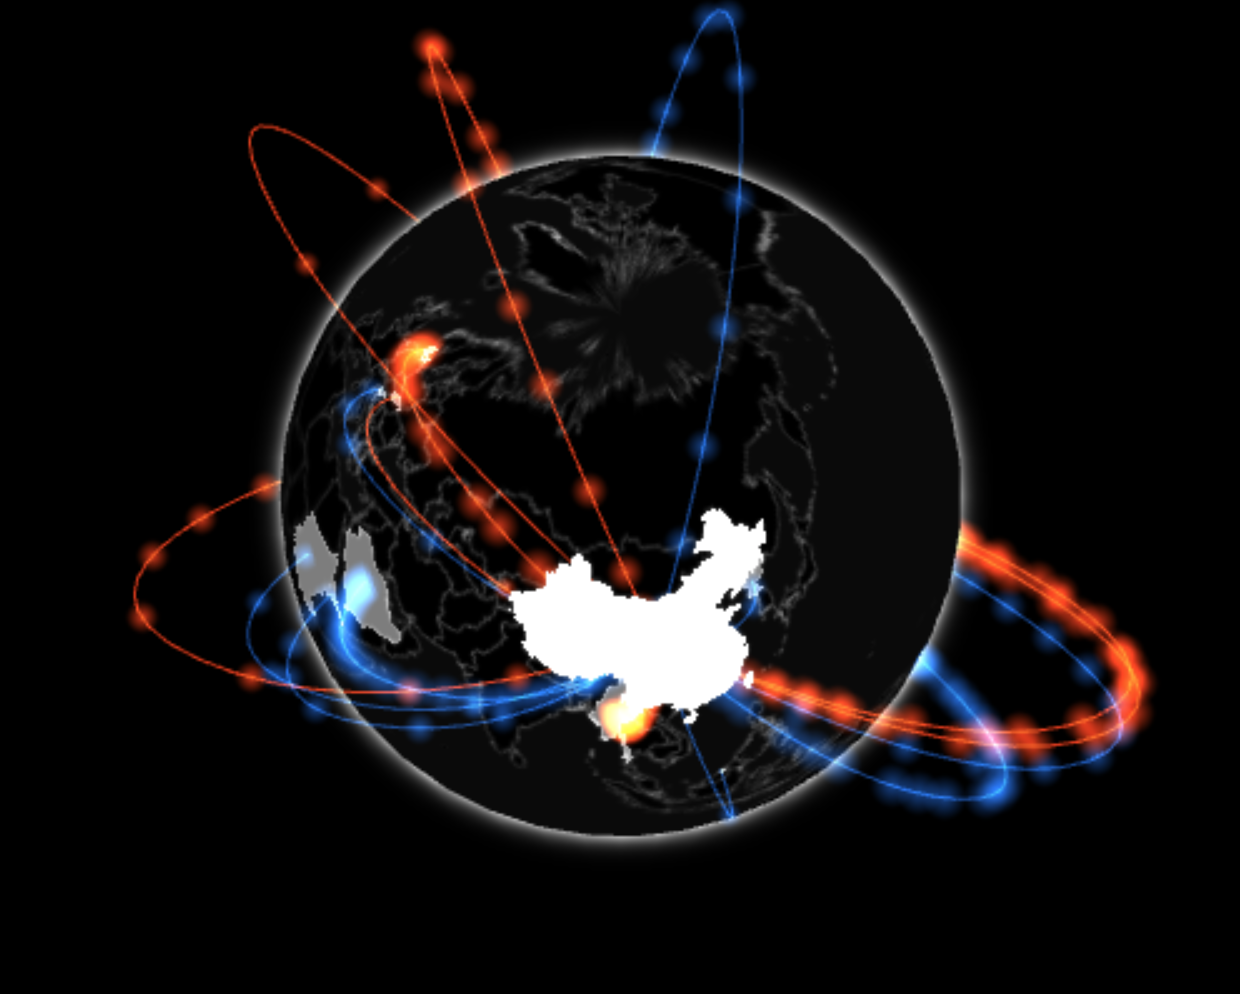
Gio.js - 3D Globe Data Visualization
Note: This post is over 7 years old. The information may be outdated.
Gio.js là thư viện nguồn mở để visualization 3D globe, xây dựng dựa trên thư viện Three.js.
Gio.js cực kỳ dễ sử dụng và dễ customize.

Cài đặt
Include Three.js dependency và Gio.js library:
<script src="https://threejs.org/build/three.min.js"></script>
<script src="https://raw.githack.com/syt123450/giojs/master/build/gio.min.js"></script>
Tạo thẻ <div> để render:
<!doctype html>
<html>
  <head>
    <!-- include three.min.js library-->
    <script src="three.min.js"></script>

    <!-- include gio.min.js library-->
    <script src="gio.min.js"></script>
  </head>
  <body>
    <!-- container to draw 3D Gio globe-->
    <div id="globalArea"></div>
  </body>
</html>
Khởi tạo và render dữ liệu:
<script>
  // get the container to hold the IO globe
  var container = document.getElementById('globalArea')

  // create controller for the IO globe, input the container as the parameter
  var controller = new GIO.Controller(container)

  // use addData() API to add the the data to the controller, know more about data format check out documentation about data: http://giojs.org/html/docs/dataIntro.html
  controller.addData(data)

  // call the init() API to show the IO globe in the browser
  controller.init()
</script>
Xem ví dụ tại Codepen.
References
- Gio.js API document: http://giojs.org/html/docs/index.html
- https://github.com/syt123450/giojs